How to calculate marginal ROI and stop wasting ad spend
Analytical Alley Team
Marketing Analytics Experts
Are you certain that your next euro of ad spend will actually return a profit? For many B2C brands scaling budgets, platform dashboards hide a painful reality: average returns look excellent while you...
Are you certain that your next euro of ad spend will actually return a profit? For many B2C brands scaling budgets, platform dashboards hide a painful reality: average returns look excellent while your newest spend is actively losing money.
Why average ROI is costing your B2C brand money
Most B2C marketing teams make critical budget allocation decisions based on average return on investment. If paid social shows an average return on ad spend (ROAS) of 4:1 and programmatic display shows 2:1, the natural instinct is to push more budget into social.
However, average metrics only describe past performance. They do not tell you what will happen to the next euro you invest.
In digital advertising, every channel is subject to a diminishing returns curve in marketing. As you increase spend, you gradually exhaust your highest-intent audiences. Eventually, the cost to acquire the next customer rises, and the overall returns flatten out.
A high-performing channel can easily have a stellar average ROI but a terrible marginal ROI at your current spend level. If you are already at the saturation point, adding another €20,000 to that channel might yield a marginal return of less than 1:1, meaning you are actively losing money on that incremental spend. To avoid this, you must look at comparing incremental ROI versus platform ROAS to uncover the true value of your media investments.
How to calculate marginal ROI
Marginal ROI, also referred to as marginal ROAS, measures the additional revenue generated by the next segment of your advertising budget.
The mathematical formula is:
Marginal ROI=Ad Spend / Incremental Revenue
Where:
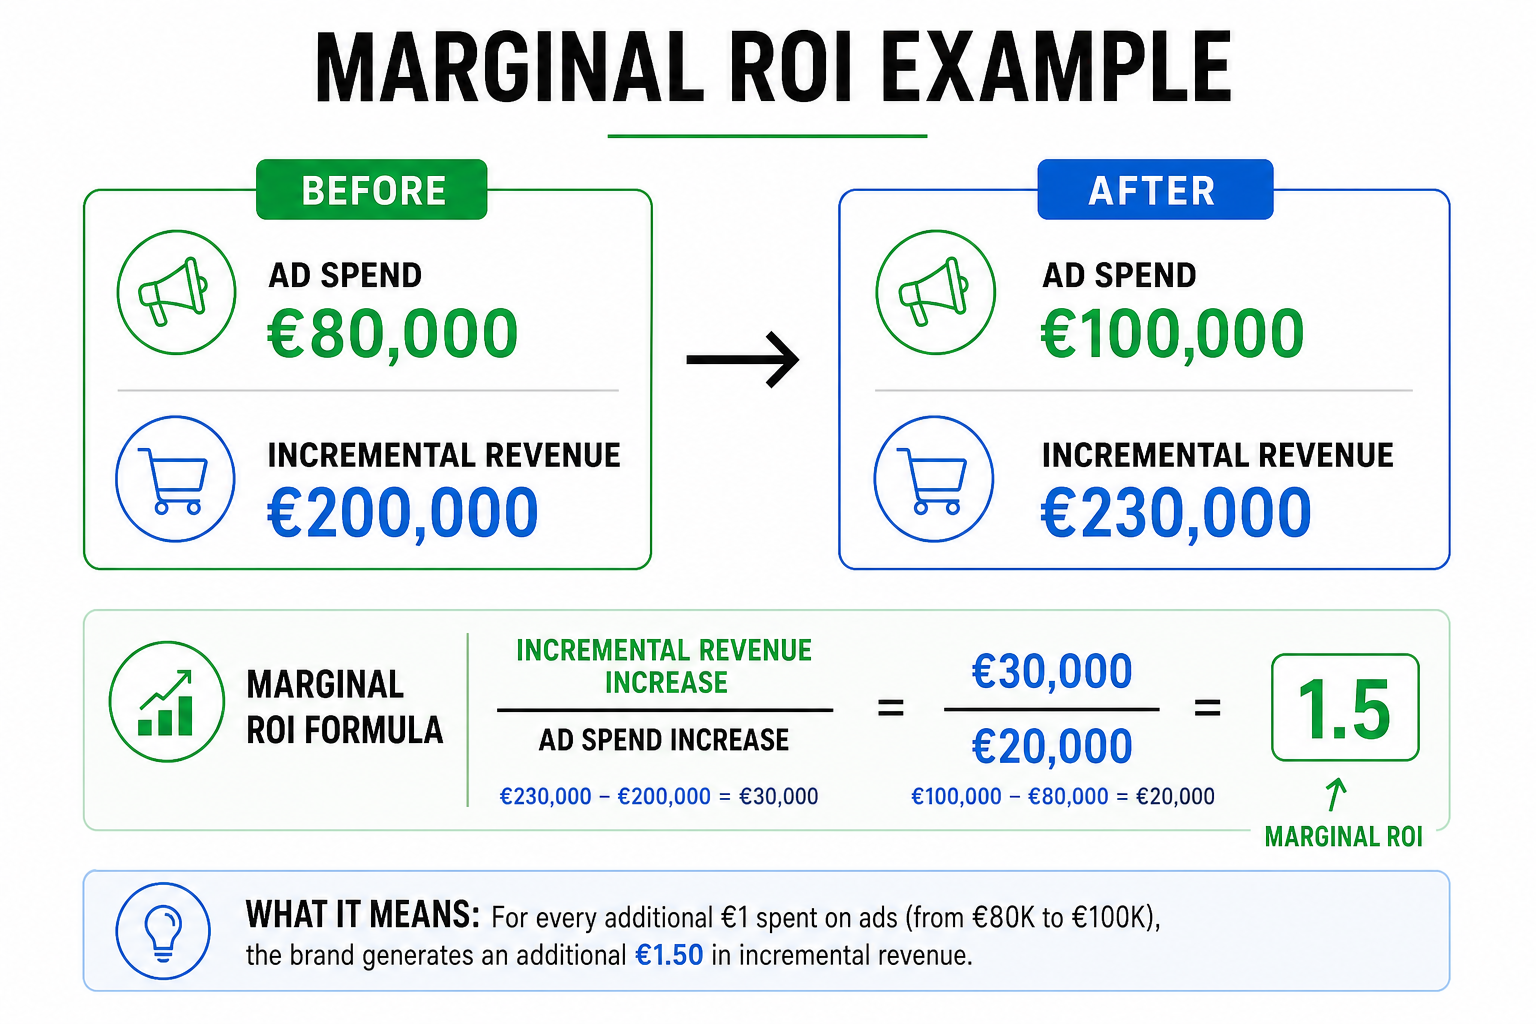
To understand this in practice, let us look at a concrete calculation example. Suppose your B2C e-commerce brand currently spends €80,000 per month on paid social, which generates €200,000 in incremental revenue. You decide to increase your monthly spend to €100,000. Under this new budget, your incremental revenue rises to €230,000.
To calculate the marginal ROI of this scale-up:
Although the campaign's average ROI at the €100,000 spend level is still 2.3:1 (meaning every €1 spent generates €2.30 in incremental revenue on average), the marginal ROI on the additional €20,000 investment is only 1.5:1. In other words, each extra €1 invested beyond the original budget generates only €1.50 in incremental revenue. If your gross margin is below 67%, this additional investment would not be profitable, even though the campaign's overall average ROI still appears strong.
Isolating incrementality with econometric models
The primary challenge in calculating marginal ROI is isolating the true delta in incremental revenue. Platform attribution models frequently credit organic conversions to paid campaigns, obscuring your actual baseline performance.
To solve this, B2C brands use marketing mix modeling. This econometric approach uses statistical analysis of historical data to separate baseline performance from promotional lift. By separating base vs incremental sales, you can control for external variables like seasonality, price promotions, competitor actions, and macroeconomic trends to isolate the exact sales lift generated by your marketing.
This process involves two core econometric transformations:
By choosing econometrics vs attribution platforms, you gain a transparent, privacy-safe view of your performance that aligns directly with your financial systems.
Optimizing your budget across channels
Once you map the saturation curves for each of your digital channels, you can apply the golden rule of marketing spend optimization. To maximize total revenue, you must allocate budget so that marginal ROI is equalized across all channels.
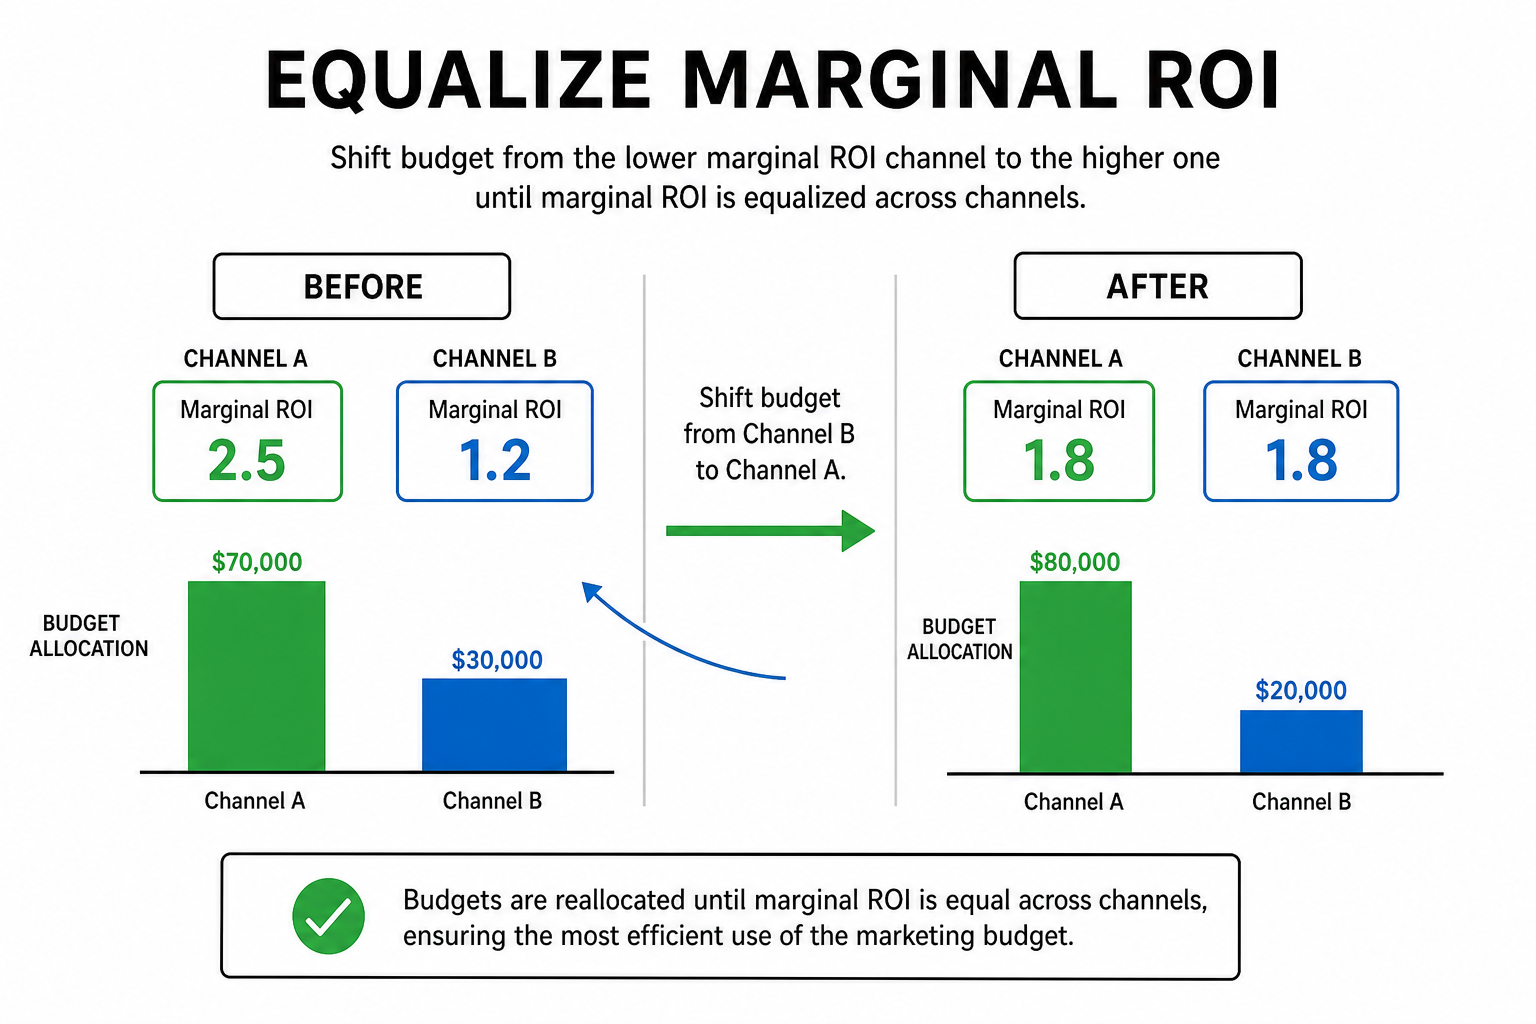
If Channel A has a marginal ROI of 2.5 and Channel B has a marginal ROI of 1.2, every euro you shift from Channel B to Channel A will increase your total revenue without increasing your overall budget. You should continue reallocating capital until the next euro spent in either channel yields the exact same return.
For media buyers, this provides clear rules for scaling or throttling campaign budgets. For C-suite executives, it offers a robust framework for making confident, data-driven decisions that withstand financial scrutiny.
To stop relying on misleading platform attribution and start capturing the true profitability of your media mix, explore our specialized solutions for marketers and solutions for executives.
Ready to see how econometric modeling can optimize your spend? You can book a demo with Analytical Alley today to slash ad waste and accurately predict the impact of your marketing decisions.
Get Marketing Analytics Insights
Monthly briefings on marketing mix modeling, budget optimisation and what's actually moving the needle for European brands.