Optimizing iGaming media efficiency with econometrics
Analytical Alley Team
Marketing Analytics Experts
Is your player acquisition strategy hitting a wall of diminishing returns? In the competitive iGaming landscape, traditional attribution often hides the fact that up to 40% of your media spend is wast...
Is your player acquisition strategy hitting a wall of diminishing returns? In the competitive iGaming landscape, traditional attribution often hides the fact that up to 40% of your media spend is wasted on over- or undersaturated media channels.
The rising cost of player acquisition
Acquiring high-value players is becoming increasingly expensive across European and international markets.
Relying solely on platform attribution leads to significant budget leakage. Research indicates that 20% to 30% of iGaming attribution is wasted due to channel overlap, particularly the complex interplay between paid social and search. When you measure these channels in isolation, you risk overfunding saturated segments while starving your high-growth opportunities.
Why last-click fails the iGaming sector
Most digital tracking tools fail to account for the halo effect of brand marketing or the impact of external variables like major sporting events and regulatory changes. Last-click models often over-credit bottom-of-funnel channels, which ignores the vital incremental lift generated by your top-of-funnel activity.
Sophisticated marketing mix modeling solves this by using time-series regression to isolate the true incremental impact of every euro spent. This econometric approach accounts for several critical factors:
Using econometrics to eliminate ad waste
The core value of understanding econometrics vs attribution lies in the ability to map diminishing returns. Every channel follows a distinct saturation curve, moving through three specific phases.
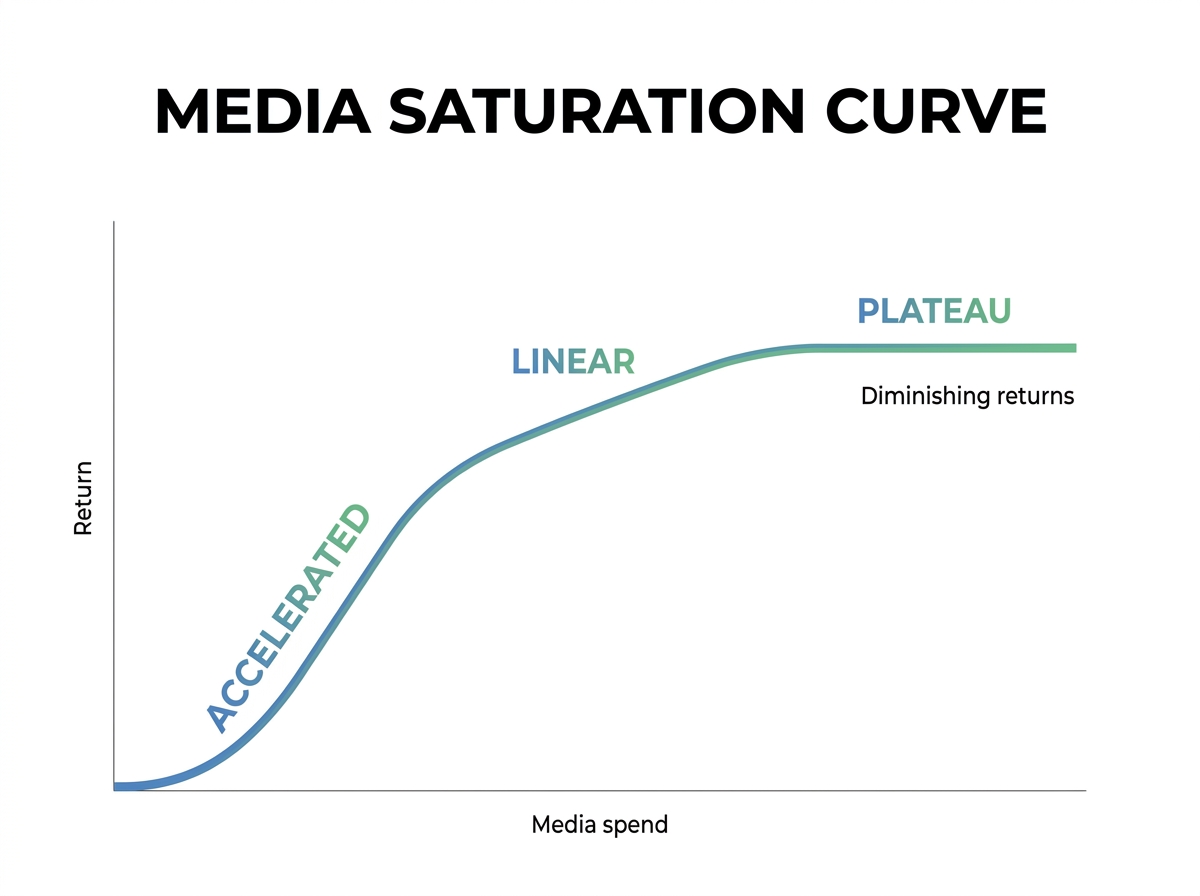
By applying a multivariable model, marketing strategists can identify exactly which channels have reached a plateau. Our approach facilitates marketing spend optimization by simulating millions of budget scenarios. This allows you to reallocate funds from saturated digital channels to high-incremental options like CTV or podcasts, often improving ROI by 25% to 40%.
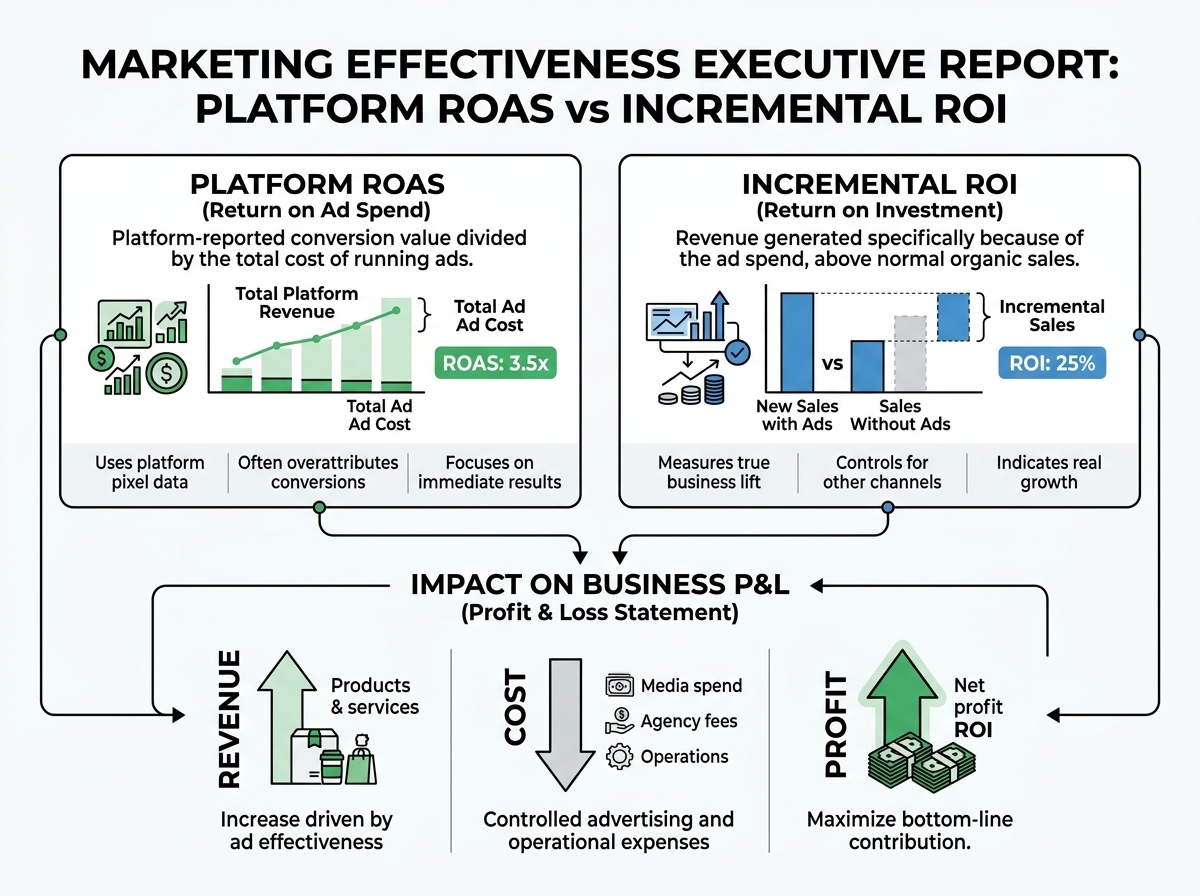
Quantifying the impact for the C-suite
For CMOs and CFOs, econometric modeling provides a P&L-linked view of marketing effectiveness. Instead of focusing on vanity metrics, leadership can concentrate on the incremental ROI vs platform ROAS.
The standard regression equation used to determine these insights follows this logic:
$Conversions = Base + beta_{1}(Media_{1}) + dots + beta_{n}(Media_{n}) + gamma(External Factors) + epsilon$
In this formula, $beta$ represents the coefficient of incremental contribution for each specific channel. This mathematical rigor allows marketing mix modeling for the gaming sector to reach prediction accuracies of over 90%.
Strategic outcomes for iGaming operators
Implementing a robust econometric framework typically results in a 15% to 25% reduction in player acquisition costs and a significant boost in net gaming revenue contribution. By identifying the 30% to 50% saturation common in paid social, operators can pivot their strategy before performance plateaus.
This data-driven governance ensures that your budget decisions are based on statistical ground truth rather than platform bias. It allows your team to achieve a payback period of under six months, which is critical for sustainable growth in highly regulated markets.
If you are ready to stop guessing and start measuring the true incrementality of your media spend, you can book a demo to see how our models can slash your ad waste by up to 40%.
Get Marketing Analytics Insights
Monthly briefings on marketing mix modeling, budget optimisation and what's actually moving the needle for European brands.